Reports & Dashboard
Dashboard
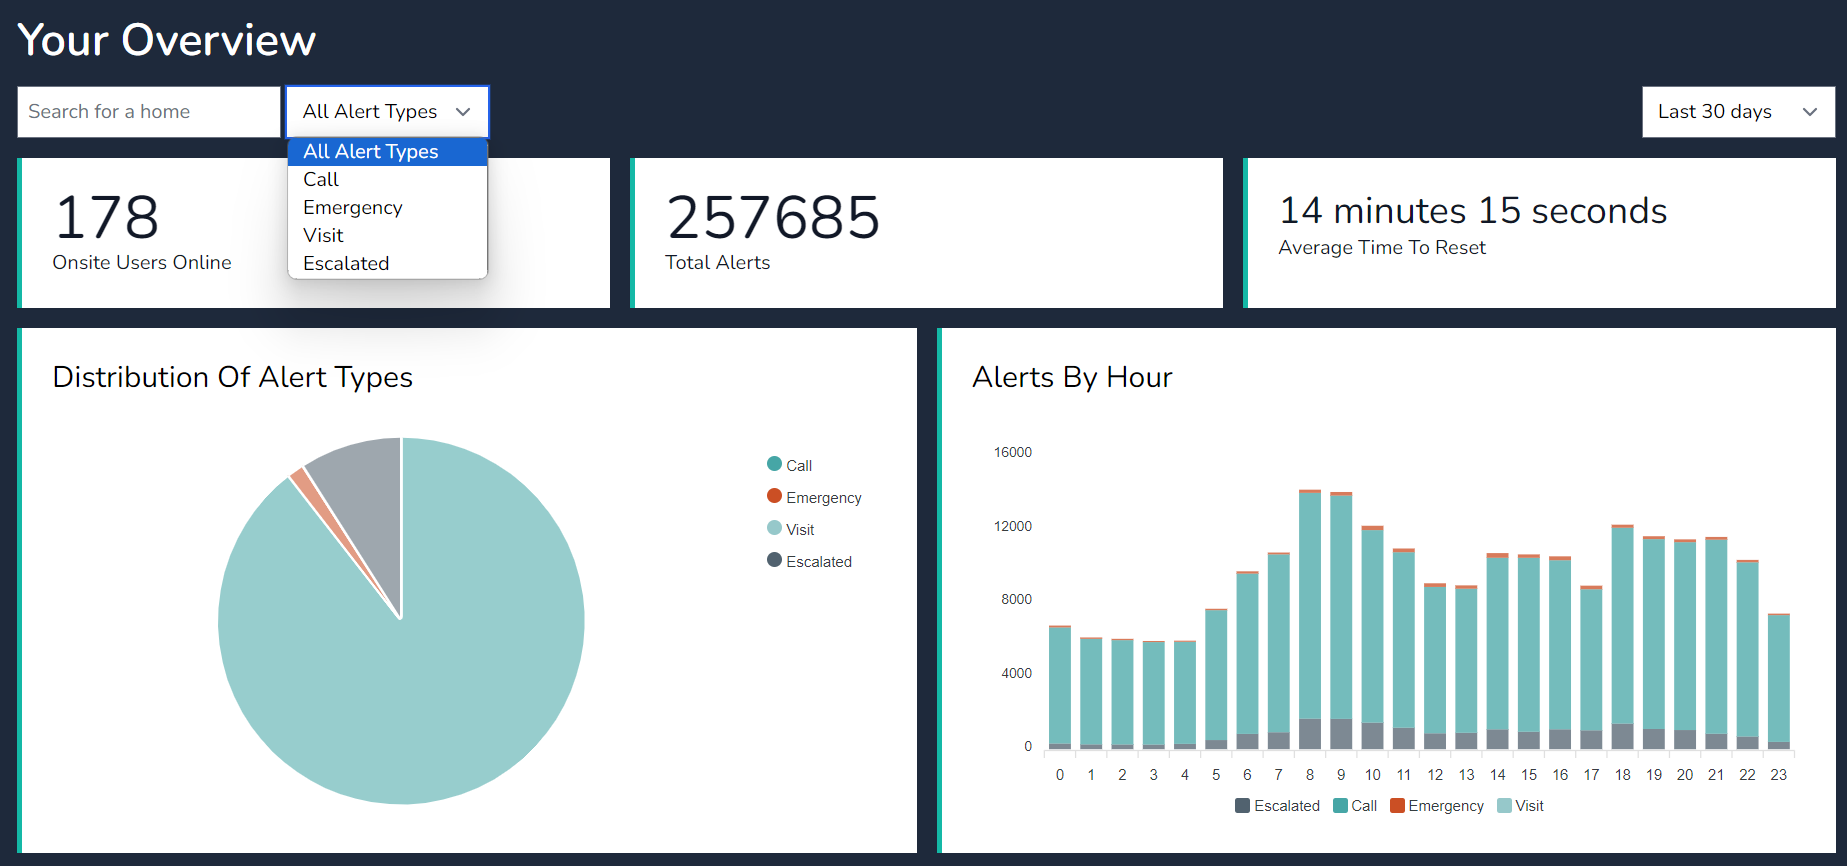
Dashboard Overview: The dashboard offers a visual snapshot of alarm management within care homes. Here are the key features:
-
Graphical Interface:
- The dashboard presents data using pie charts and graphs.
- Users can quickly assess critical information related to alarm handling.
-
Busy Hours Analysis:
- Easily identify peak activity hours when alarms are most frequent.
- This insight helps allocate staff resources effectively.
-
Average Response Time Tracking:
- View the average time taken to respond to alarms.
- View the average time taken to respond to alarms.
-
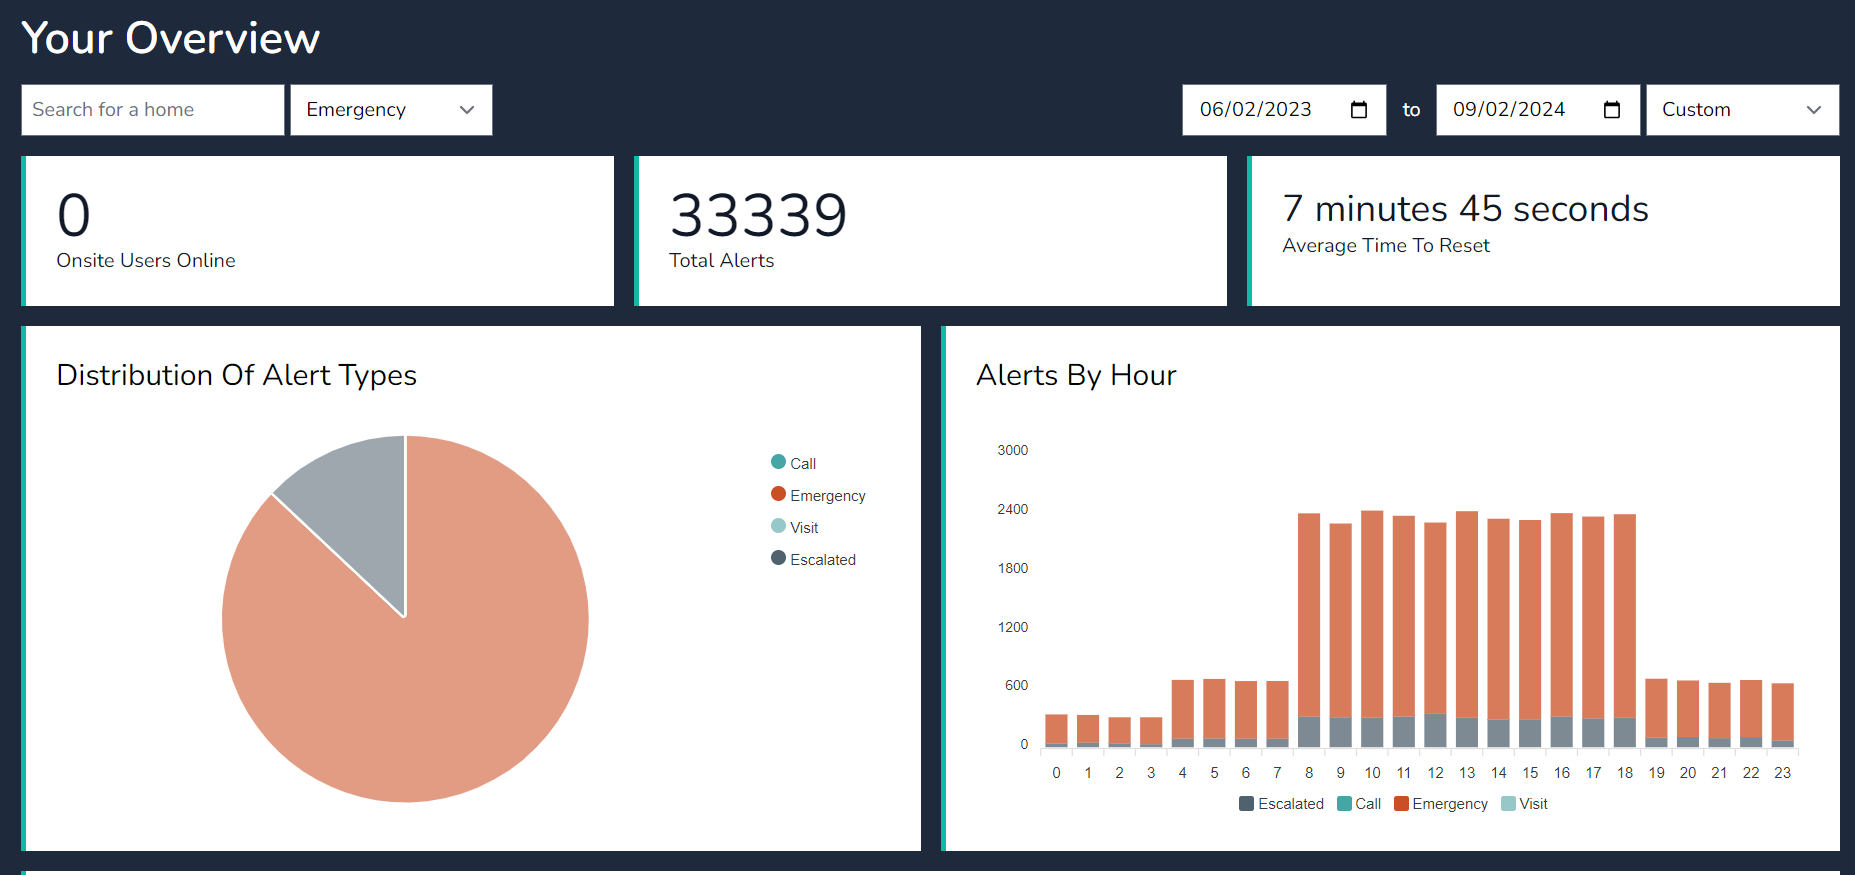
Flexible Filtering:
- Filter data by alert type (e.g., Escalated & Emergency Alarms ) or specific days.
- Custom date ranges allow in-depth analysis.
-
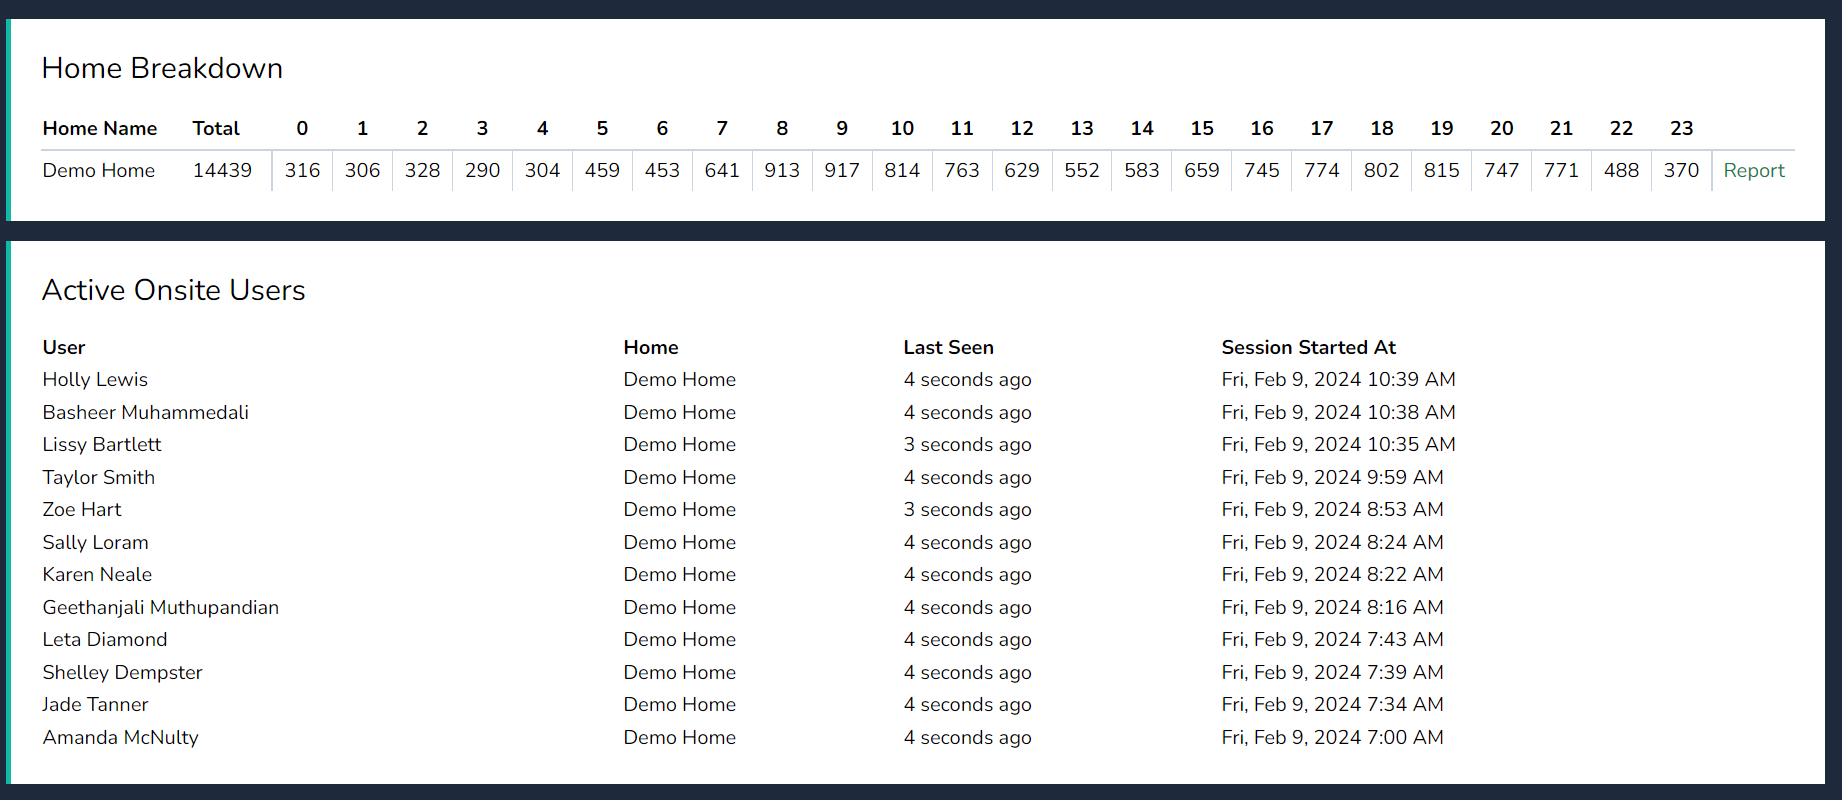
User Monitoring:
- Access a list of users currently logged into the system.
- Stay informed about user activity and system utilization.
Remember, the dashboard empowers care providers with actionable insights for better decision-making and enhanced resident care.
Reports
Overview: The system offers a comprehensive overview of nursecall activity within care homes. Users can generate system-wide reports, zone-specific insights, room-level data, and user engagement summaries. By applying consistent filters across all report pages, care providers can analyse response times, trends, and performance metrics. Additionally, reports can be scheduled for automatic email delivery on a daily, weekly, monthly, or annual basis. The platform includes real-time alerts, ensuring immediate visibility and responsiveness. With real-time monitoring, care providers can stay informed and address urgent situations promptly.
The report is structured hierarchically, starting from the highest level which is System, followed by Zone, Rooms, and Users.
Reports are currently accessible from the home management page & site reports.
-
System Report:
- The top-level overview provides information for all rooms.
- View system report by selecting the Site Report tab.
- Use the filters and date ranges to drill down in to data for the entire system.
-
Zone Report:
- Accessed under the Home Management Page.
- View the total amount of alerts each zone has received.
- Filter by Alert Type & Custom Dates
-
Room Report:
- Further down the hierarchy, we encounter the room-level report.
- Rooms correspond to physical locations within zone.
- Accessed via the Home Management tab or Site report tab.
- Under the home management tab, Rooms are sorted in name order
- Under the Site Reports tab Rooms are sorted in the highest alert order.
-
User Report:
- Finally, we have the user report.
- This focuses on individual users, their activities, and interactions within the home
- Metrics may include user behavior, access patterns, and alerts accepted vents.
-
Accessing the System Report:
- From the home management page, select the view home report tile.
- Alternatively, navigate to the site report tab.
-
Filtering Data:
-
- Change the filters on the page to show the calculated data for the filter set for the whole home. report.
- Adjust parameters such as date range and Alert Keyword type
- The system will then calculate and display data specific to the selected filters.
-
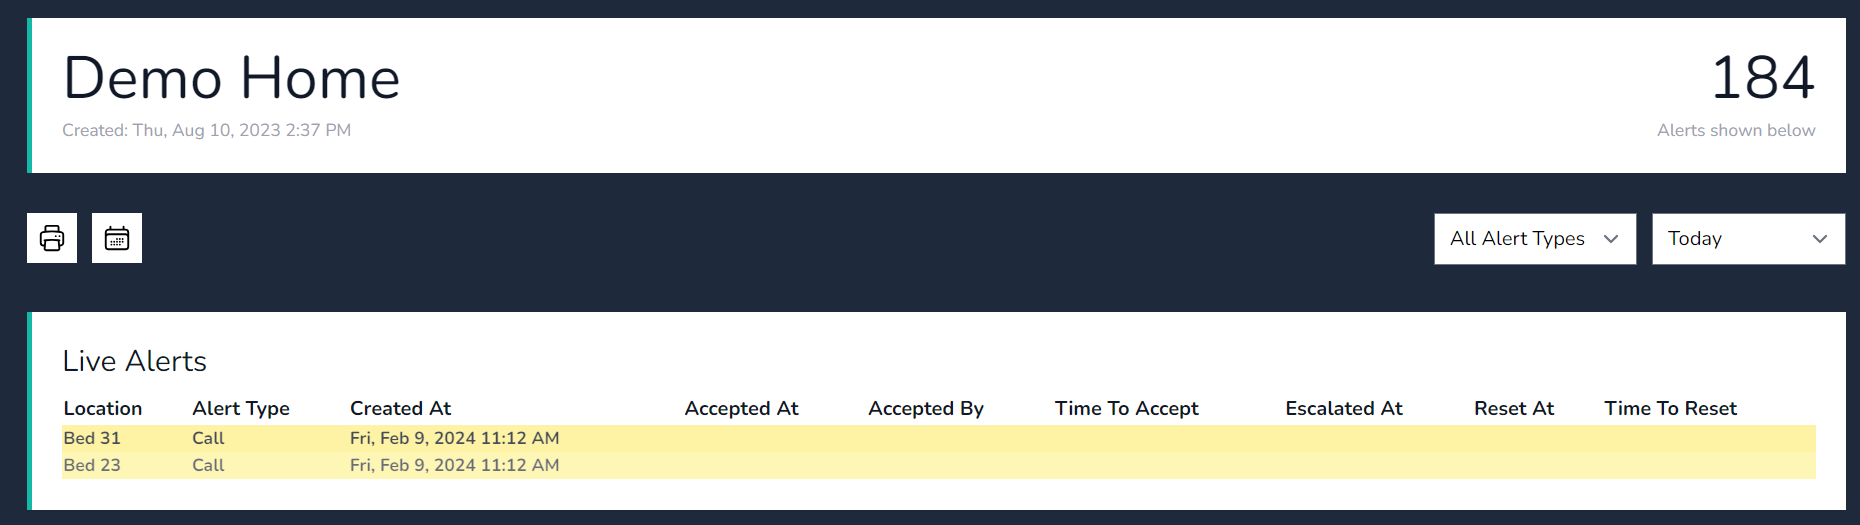
- Live Alerts show in real time on the platform, the call is highlighted with a bold colour to indicate a call is active.
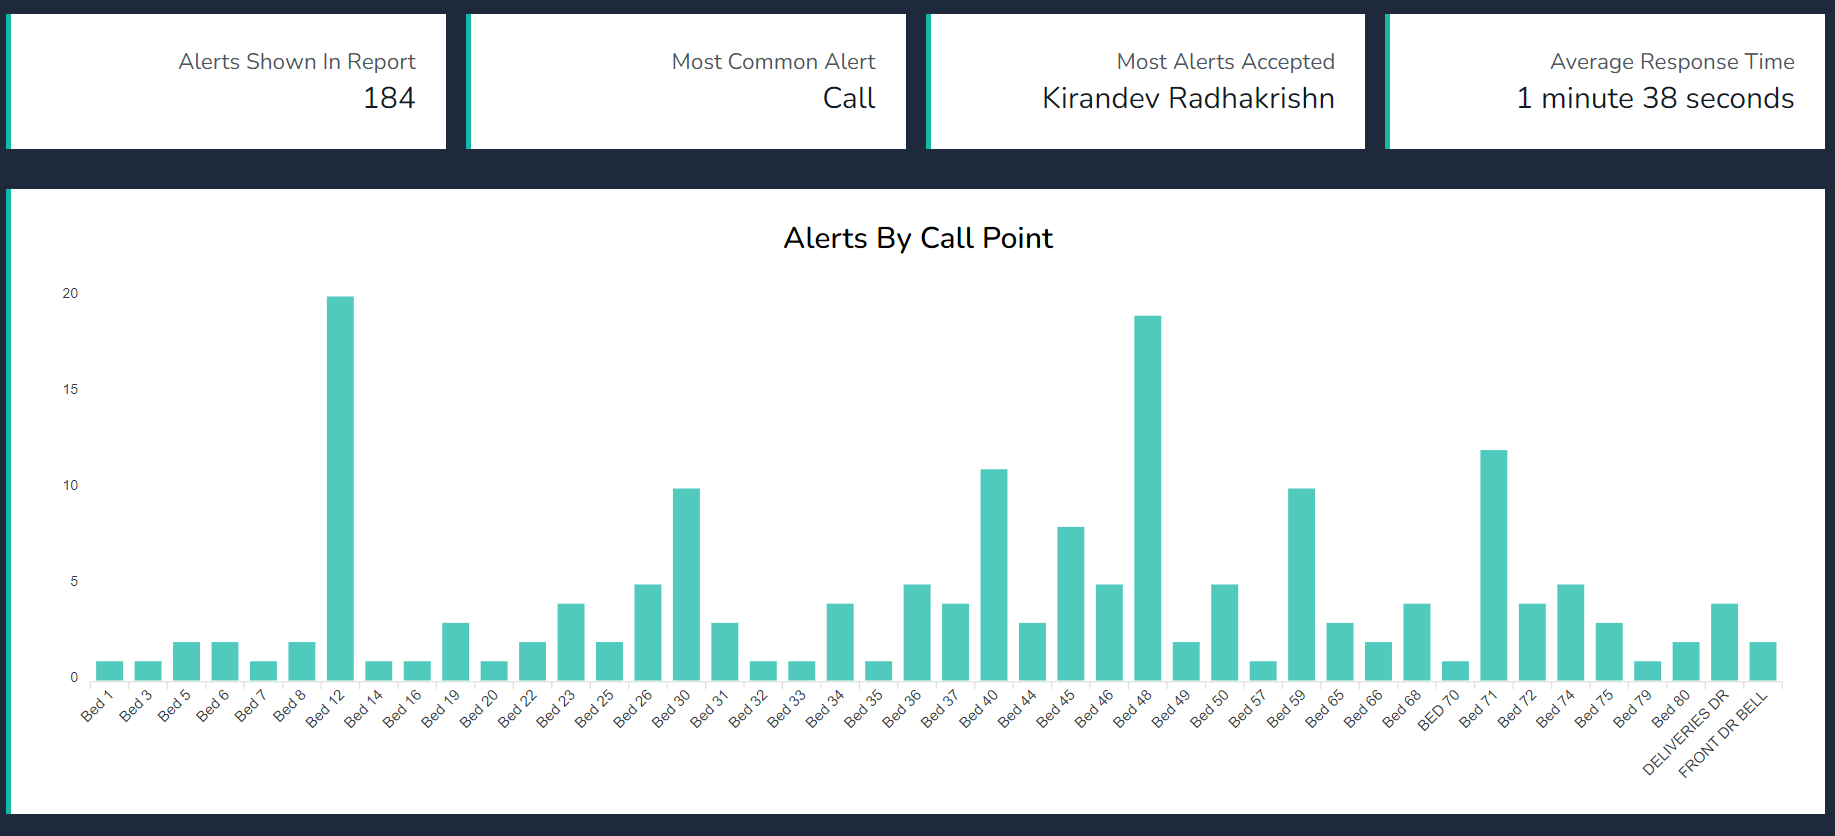
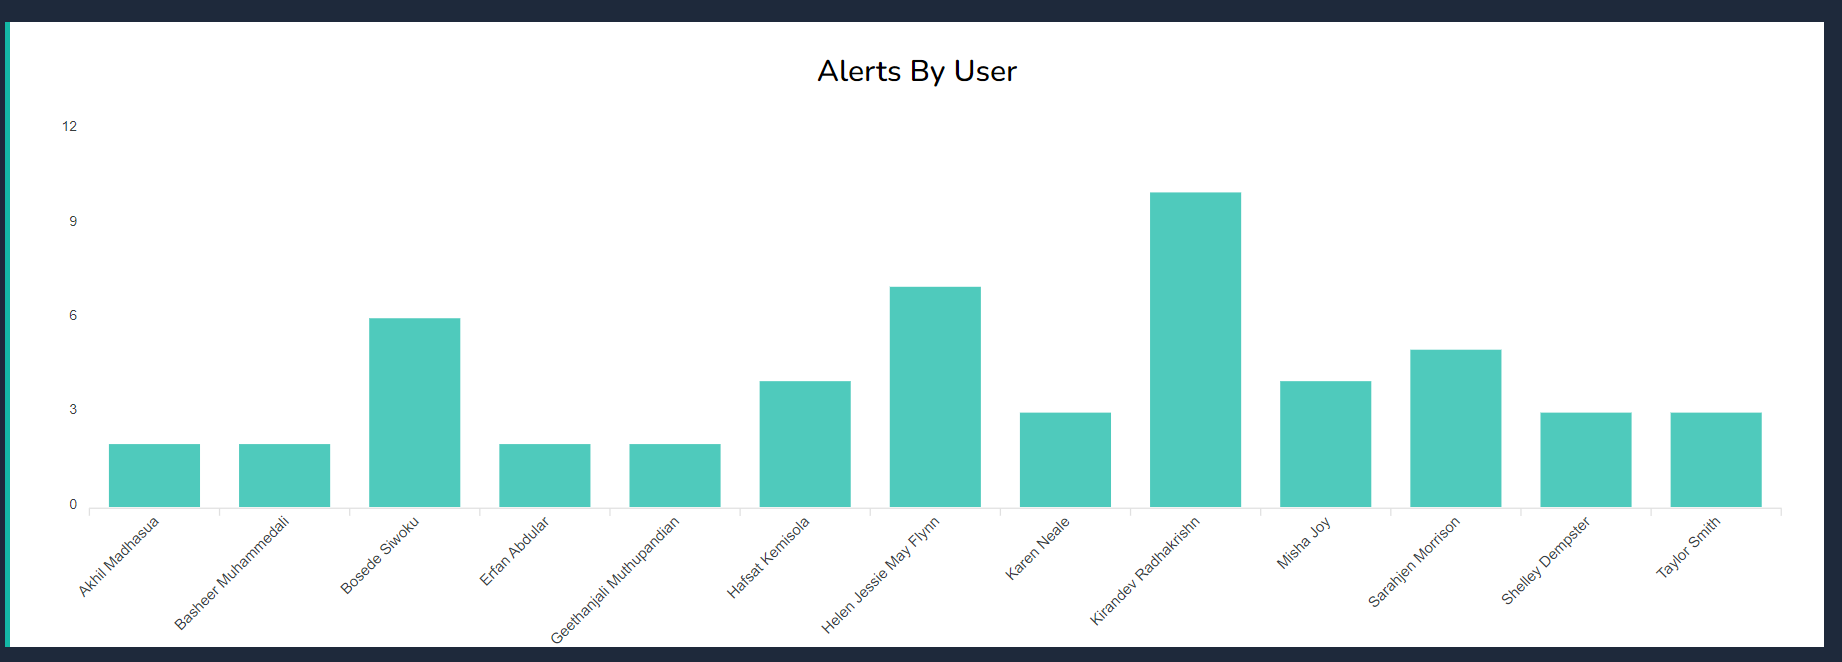
- View graphical information by Callpoints or Users.
s
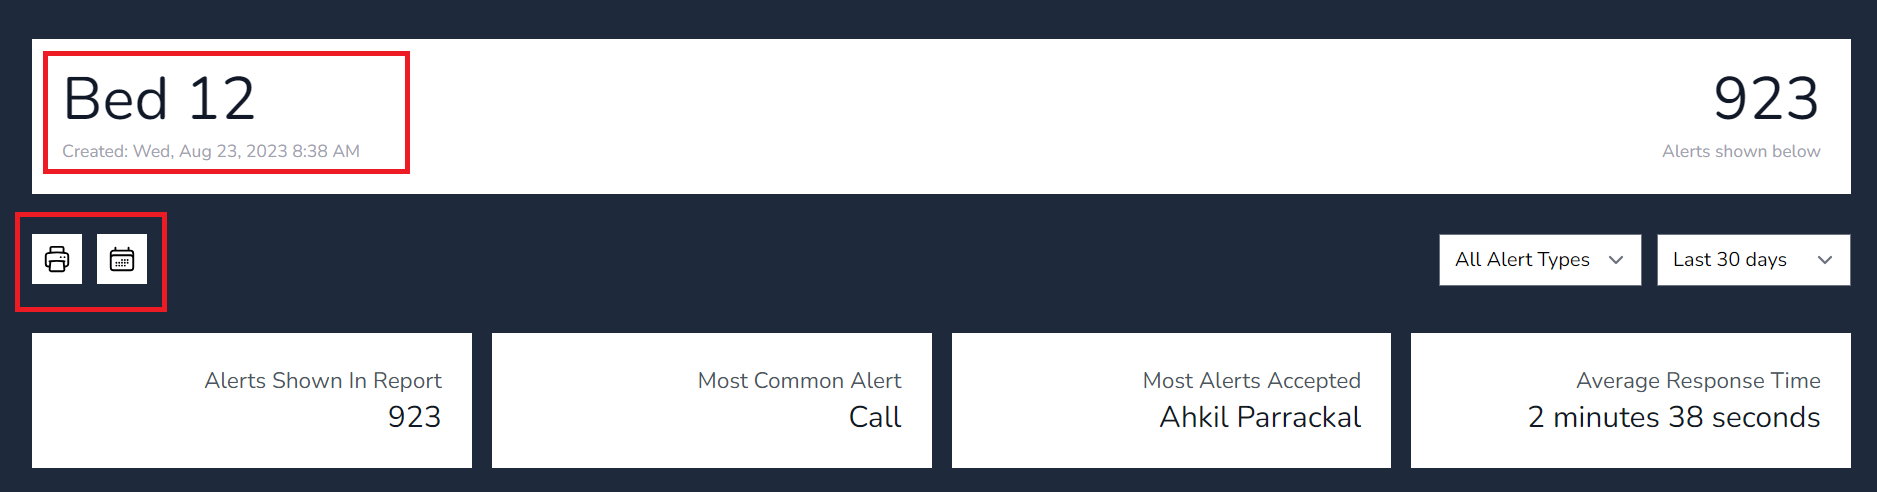
- View individual rooms reports, print to PDF or schedule a report.
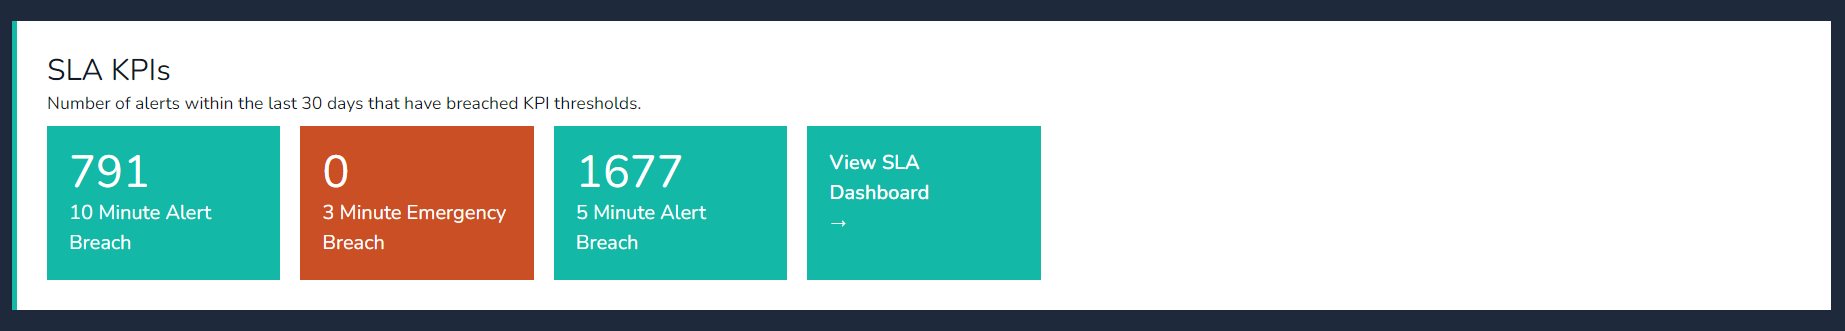
SLA KPIs
In the platform, you can create a comprehensive SLA & KPI Dashboard to efficiently monitor alerts, set metrics, and apply thresholds. Let’s break down the steps:
-
SLA & KPI Dashboard Creation:
- Navigate to the Nexus Care home and view SLA dashboard.
- Add widgets for alerts, breached SLAs, and KPI metrics.
- Navigate to the Nexus Care home and view SLA dashboard.
-
Viewing Breached Alerts:
- The dashboard should display a summary of all active alerts.
- Alerts that have breached predefined thresholds will be prominently highlighted.
-
Creating Metrics and Thresholds:
- Define the key performance indicators (KPIs) relevant to your home.
- Set thresholds for each metric.
-
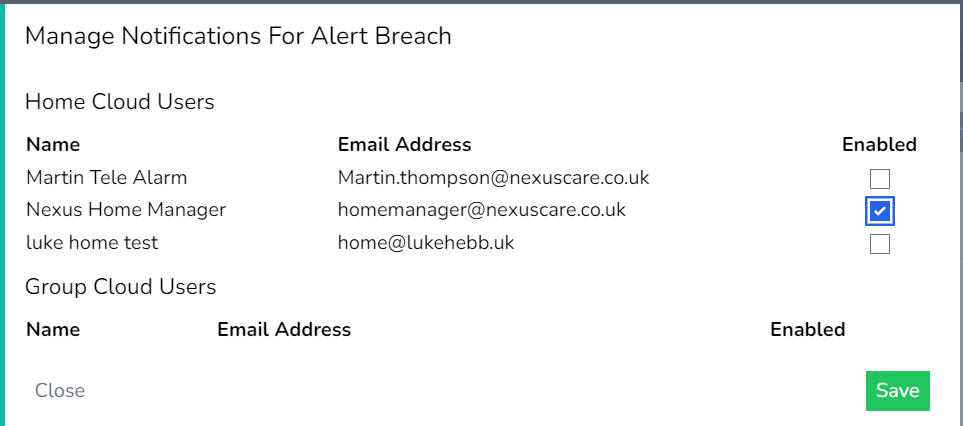
Email Notifications:
- Configure email notifications for breached thresholds.
- Receive real-time alerts via email when thresholds are breached.
- Configure email notifications for breached thresholds.
-
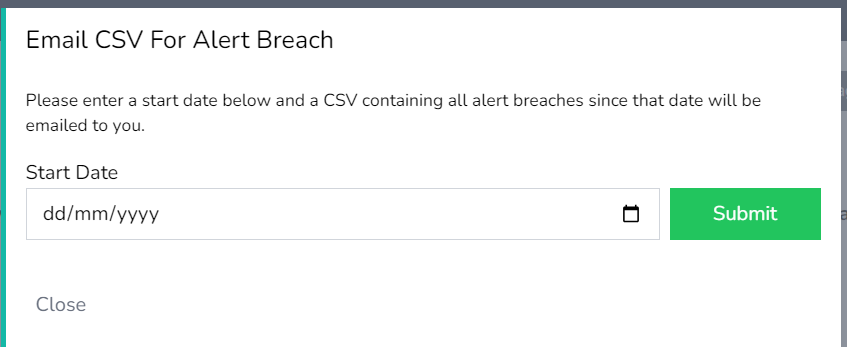
Exporting Breach Data:
- To export a list of breached alerts:
- Choose the desired date range (e.g., from a specific date to the present).
- Export the data in CSV format.
- The exported file will contain details such as timestamp, alert type & response times
- To export a list of breached alerts:
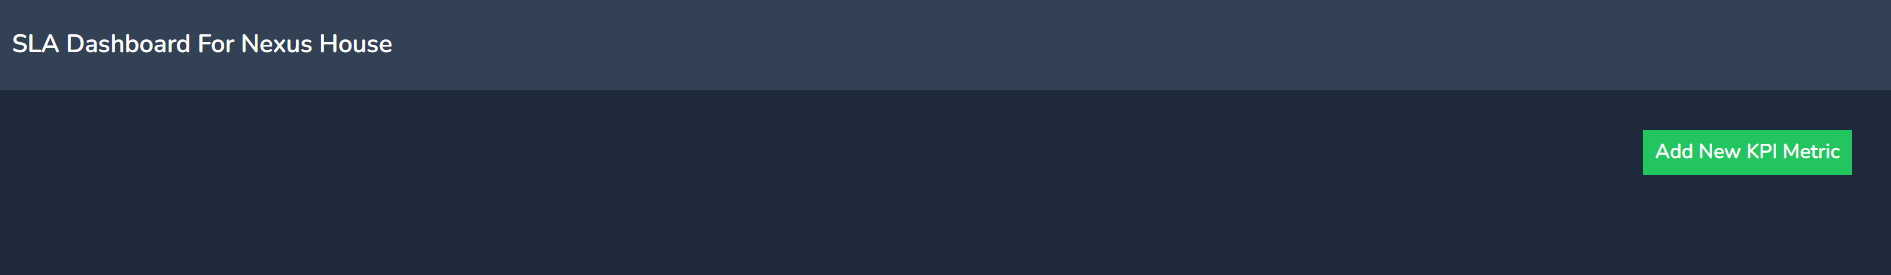
Dashboard Tile View
1. Select View SLA Dashboard Tile
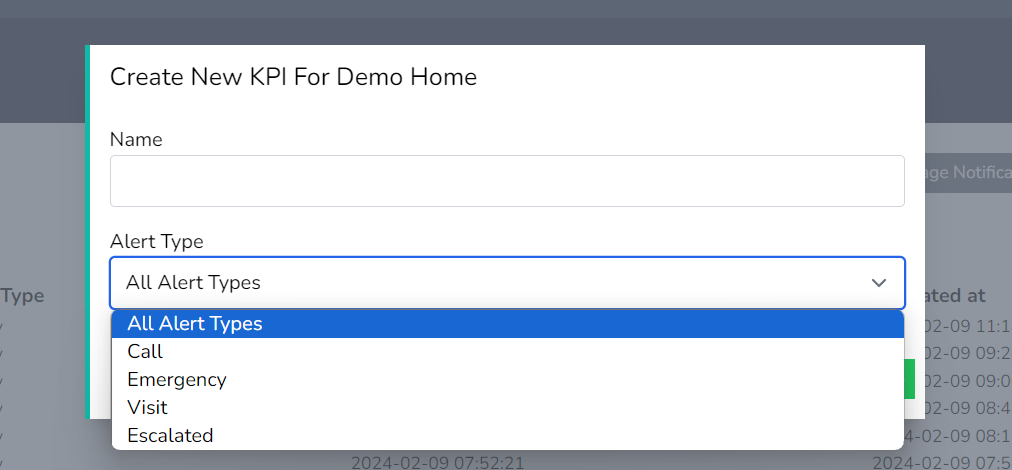
2. Add new KPI Metric
3. Add Metric name and select an Alert Type
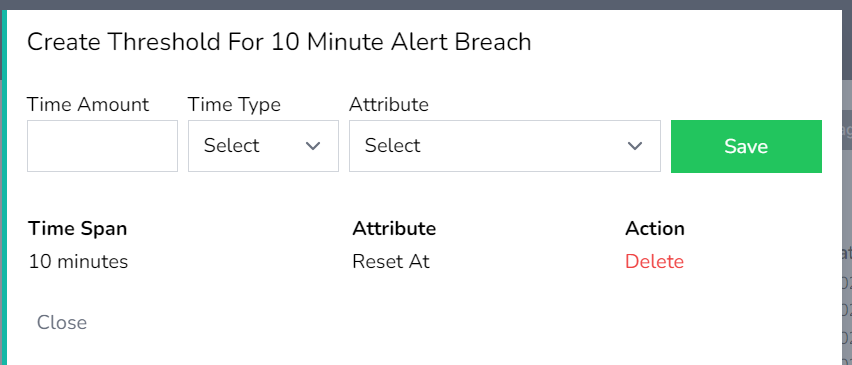
4. Select Manage Threshold and configure thresholds as required. Accepted at is for the accept on the mobile app threshold & the reset at is for the reset at callpoint threshold.
5. Email data for the threshold from any start date in time. Select the start date and press submit. An email with a link to download will follow.
6. Notifications can be sent if a threshold has been breached and users need to be notified of the breach. Enable the user(s) for the email notification & press save