SLA KPIs
In the platform, you can create a comprehensive SLA & KPI Dashboard to efficiently monitor alerts, set metrics, and apply thresholds. Let’s break down the steps:
-
SLA & KPI Dashboard Creation:
- Navigate to the Nexus Care home and view SLA dashboard.
- Look for an option to create a new dashboard or customize an existing one.
- Add widgets for alerts, breached SLAs, and KPI metrics.
-
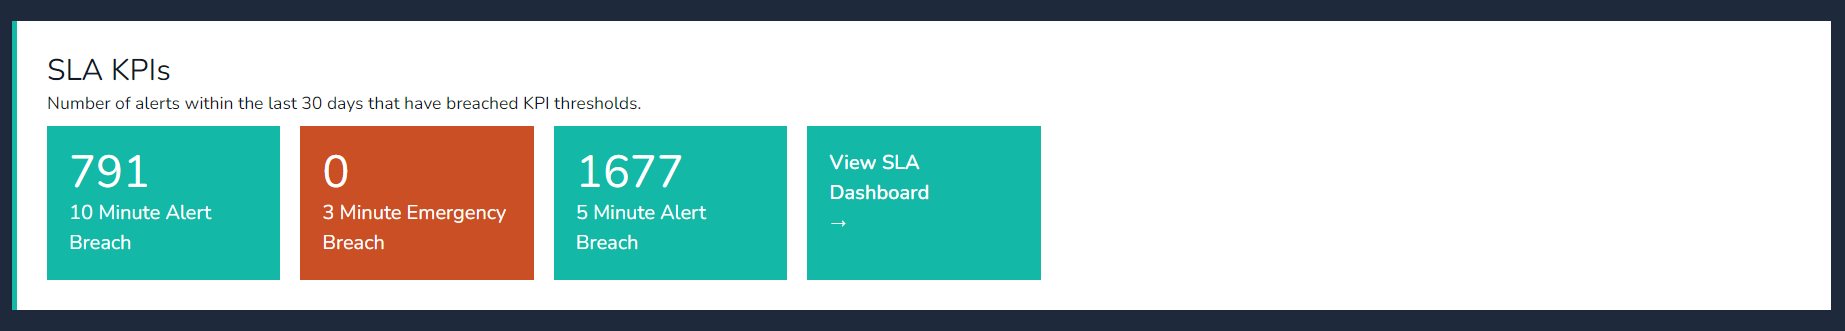
Viewing Breached Alerts:
- The dashboard should display a summary of all active alerts.
- Alerts that have breached predefined thresholds will be prominently highlighted.
- You can filter by severity, time, or specific services.
-
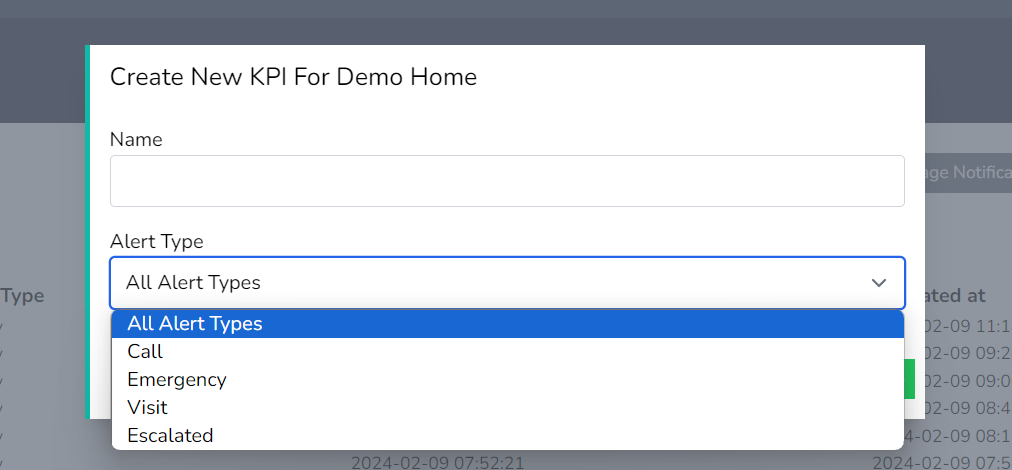
Creating Metrics and Thresholds:
- Define the key performance indicators (KPIs) relevant to your network.
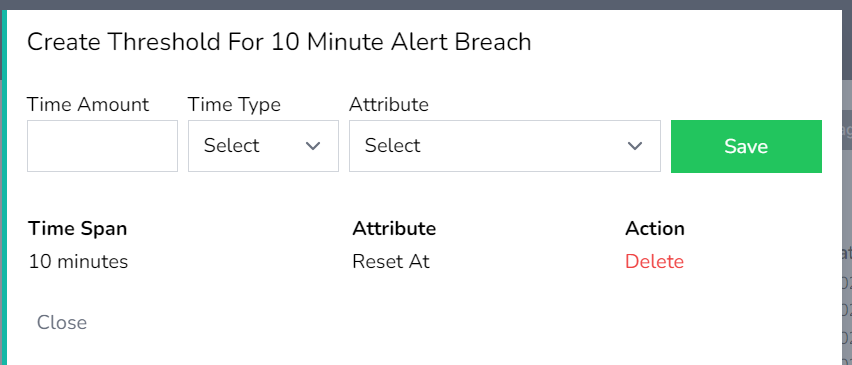
- Set thresholds for each metric. For example:
- Latency: Alert if latency exceeds 100 ms.
- Packet loss: Alert if packet loss exceeds 2%.
- Availability: Alert if availability drops below 99.9%.
-
Email Notifications:
- Configure email notifications for breached thresholds.
- Specify recipients (network administrators, team leads, etc.).
- Receive real-time alerts via email when thresholds are crossed.
-
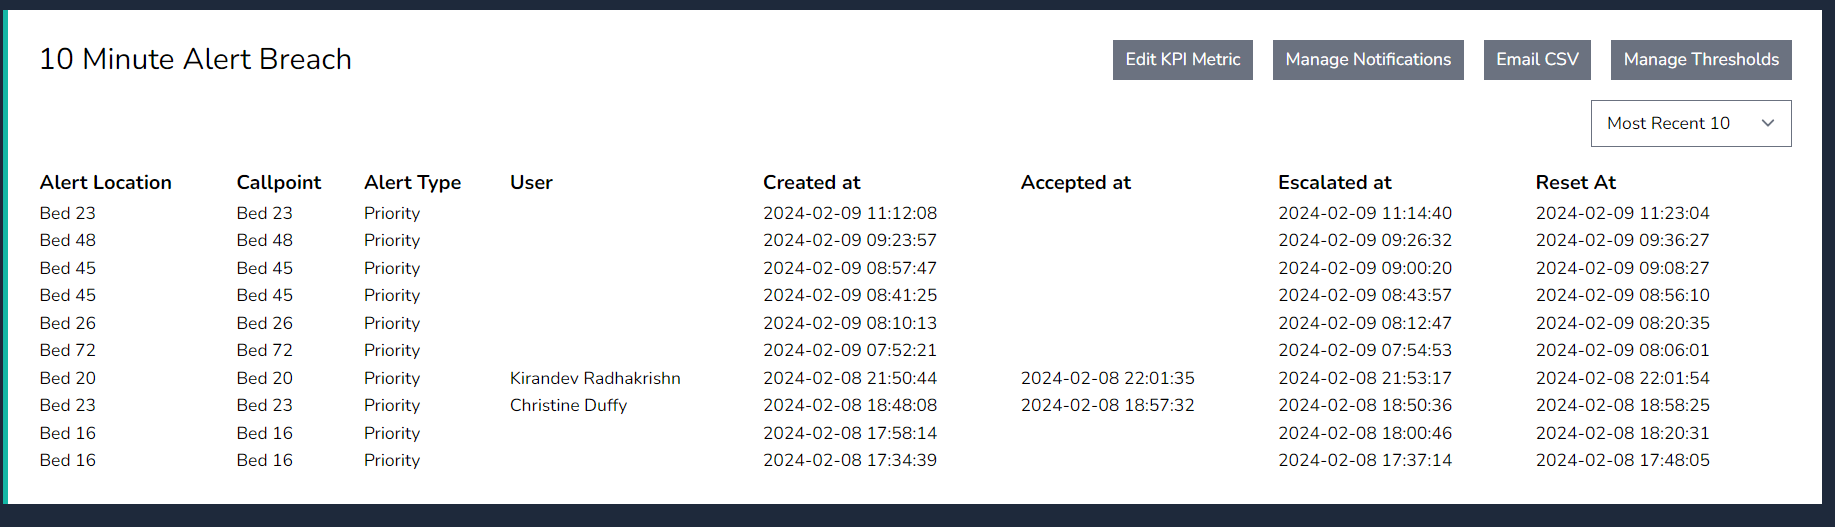
Exporting Breach Data:
- To export a list of breached alerts:
- Choose the desired date range (e.g., from a specific date to the present).
- Export the data in CSV format.
- The exported file will contain details such as timestamp, affected service, severity, and description.
- To export a list of breached alerts:
Remember to tailor these steps to your specific environment and requirements. Nexus Care provides powerful tools to streamline network management and ensure timely responses to breaches
view
v
v
dsd